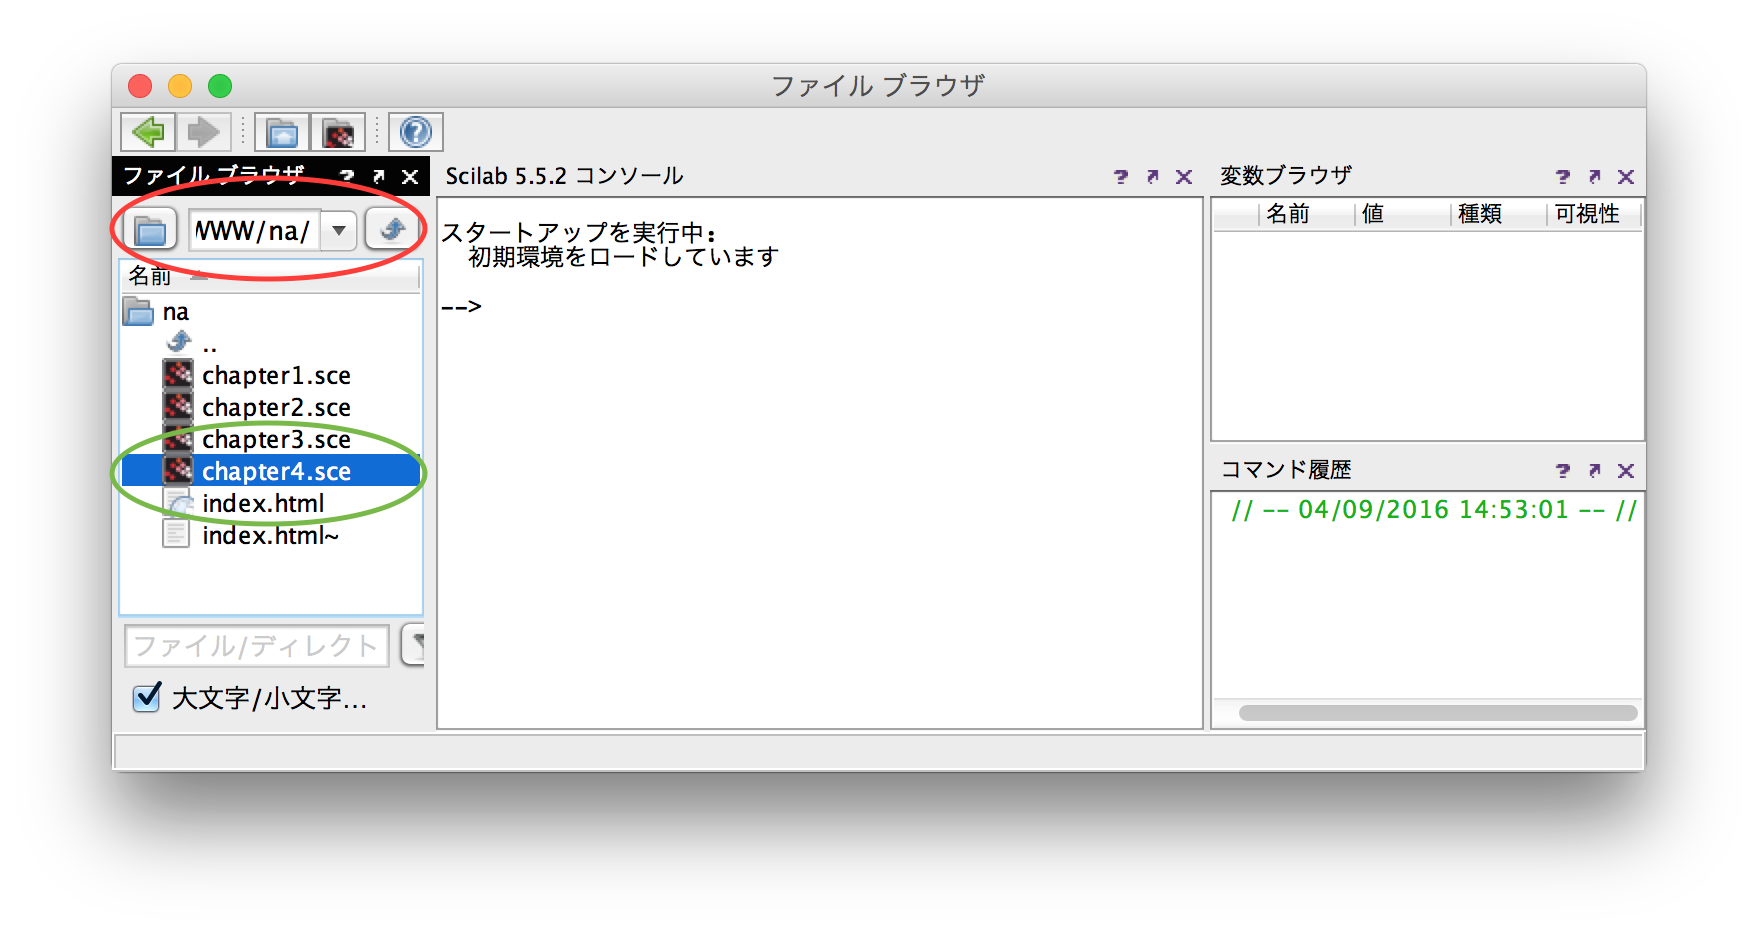
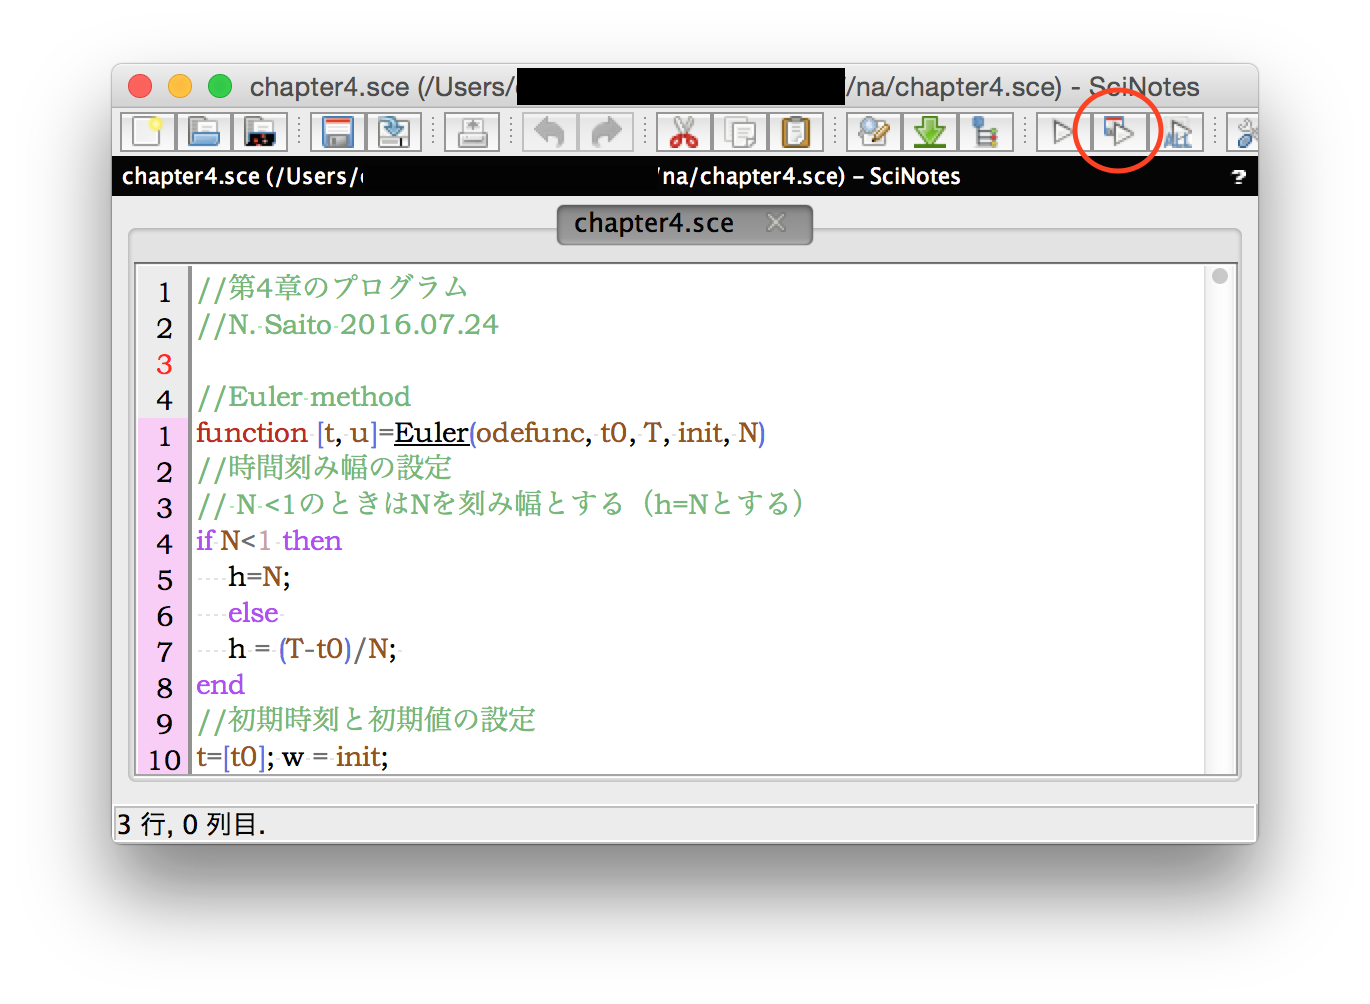
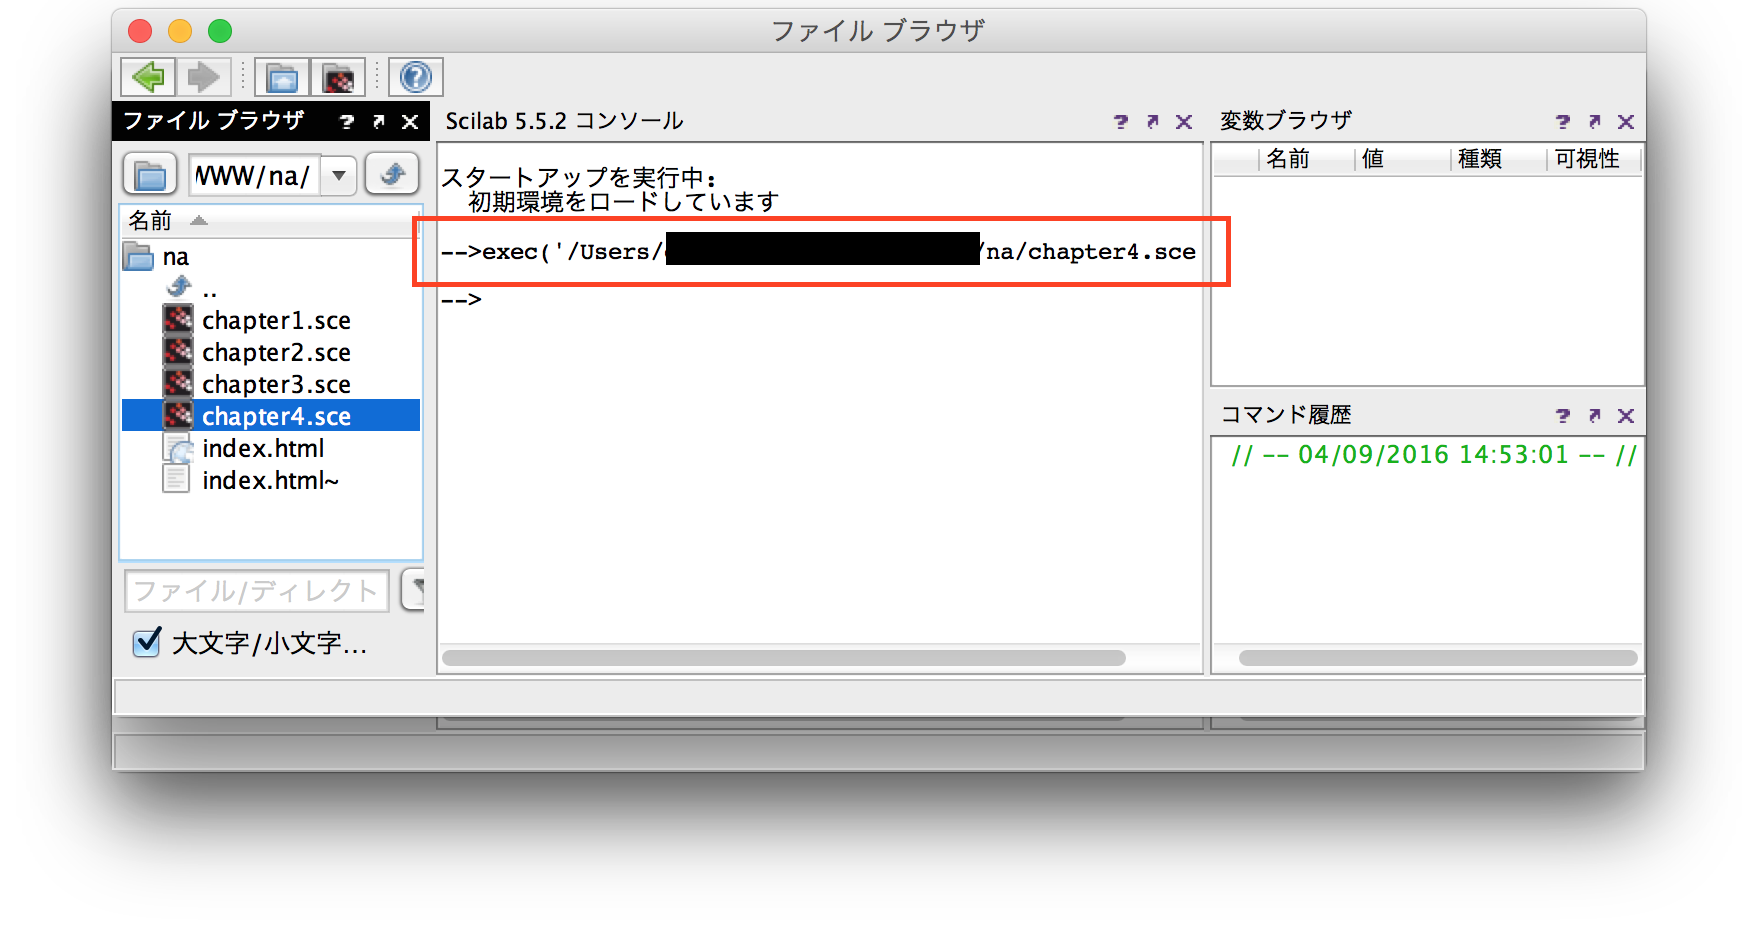
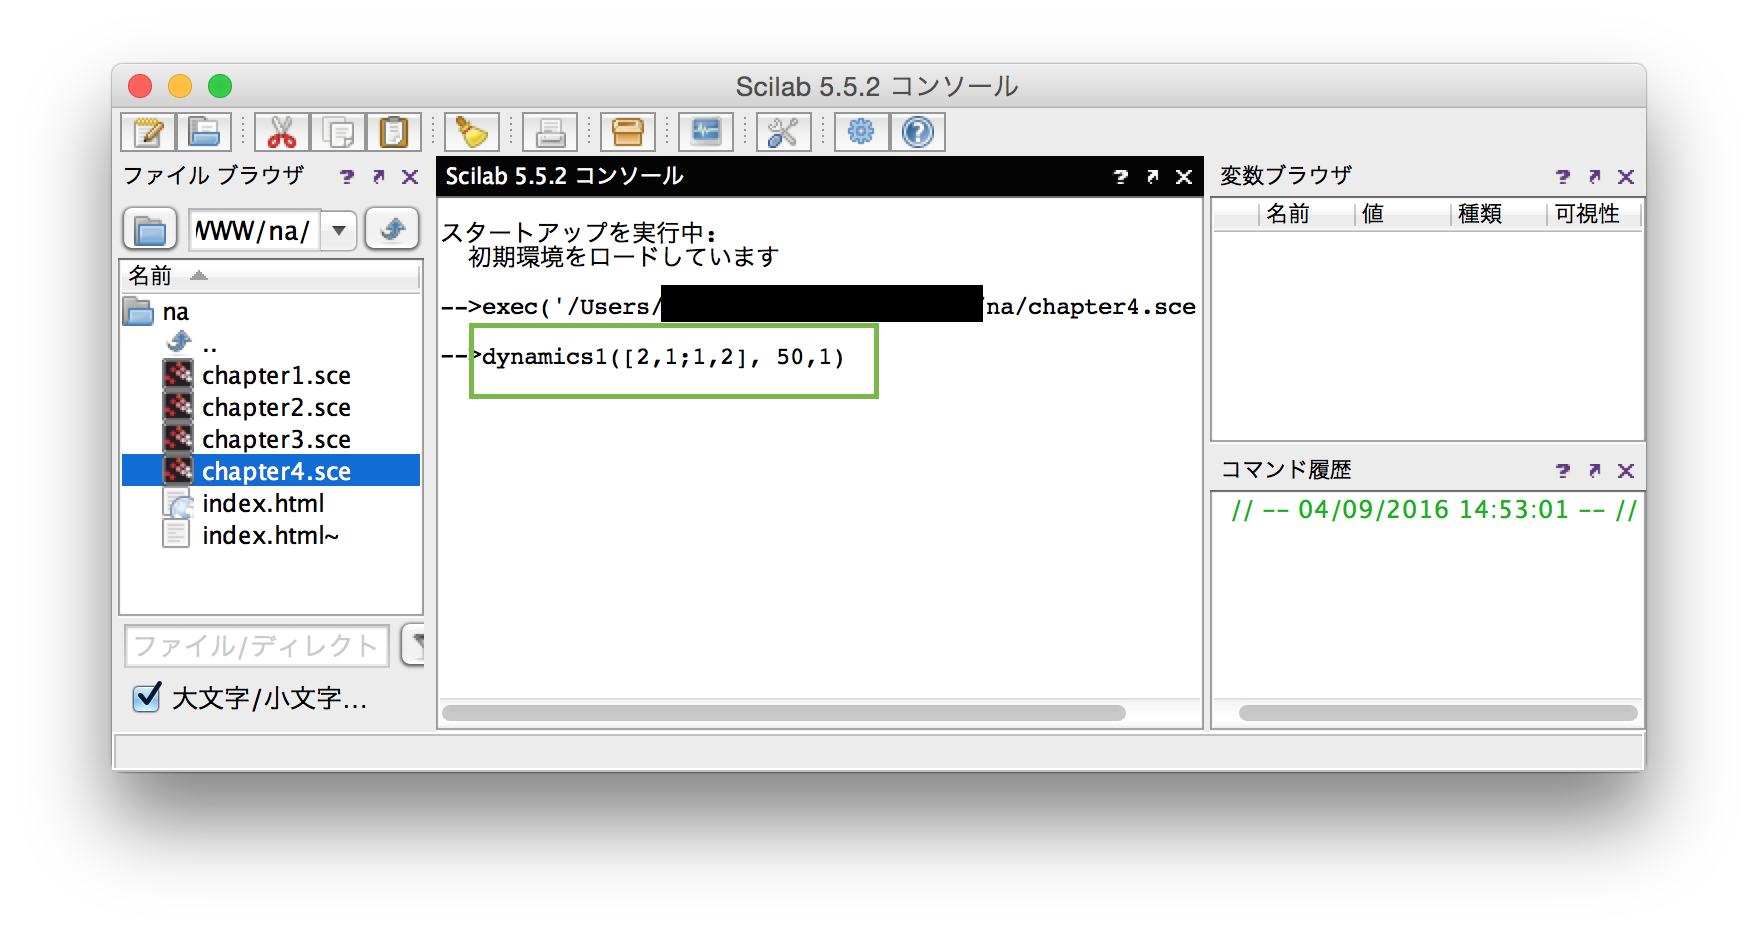
| 例/表/図 |
プログラム |
コマンド |
出力 |
| 表1.1
| chapter1.sce |
[res]=newton1(func11,dfunc11,20,1e-12,4)
[res]=newton1(func11,dfunc11,20,1e-12,3)
[res]=newton1(func11,dfunc11,20,1e-12,2)
[res]=newton1(func11,dfunc11,20,1e-12,0.5) |
|
| 表1.2
| chapter1.sce |
[res]=simp_newton1(func11,dfunc11,50,1e-12,3)
[res]=secant1(func11,20,1e-12,3,2.8)
[res]=fixed1(func11,phi1,100,1d-12,3)
[res]=fixed1(func11,phi2,10,1d-12,3) [注1を見よ] |
|
| 図1.2
| chapter1.sce |
[err1,err2,err3]=comparison1(func11,dfunc11) |
comp1.pdf |
| 表1.3
| chapter1.sce |
[pv,err]=rate1(func21,dfunc21,1,2)
ただし,現状はセカント法で計算するので,他の方法で計算するときには,プログラムの中の指示に従って,コメントアウトをする.
|
|
| 表1.4,図1.4,例1.16
| chapter1.sce |
[xv,fx,inc,k]=td_newton([-0.5;-1.2])
| mnew1.pdf |
| 表1.4,図1.5,例1.16
| chapter1.sce |
[xv,fx,inc,k]=td_newton([0.47;0.85]) |
mnew1.pdf |
| 表1.5,図1.6,例1.19
| chapter1.sce |
zz=[-2+%i,-2-%i,1,2,3+2*%i];
[k,xx]=dk1(zz, 2/5+2*%i/5, 6.18, 20)
[k,xx]=dk1(zz, 2/5+2*%i/5, 3.35, 20) |
dk1.pdf |
| 問題1.2
| chapter1.sce |
[res]=newton1(func61,dfunc61,20,1d-8,4.9)
[res]=newton1(func61,dfunc61,20,1d-8,4) |
|
| 問題1.2,図A.1
| chapter1.sce |
fplot(0,10,func61)
fplot(0,5,func61)
|
fplot1.pdf |
| 問題1.4
| chapter1.sce |
[res]=newton1(func71,dfunc71,50,1d-12,0.005)
| |
| 問題1.4,図A.2
| chapter1.sce |
fplot(0,0.01,func71) |
fplot1.pdf |
| 例2.1,表2.1,表2.3
| chapter2.sce |
format('v',15)
[res] = NI_order(0,2,func1,c_rect,Q1ex,10) |
|
| 例2.1,表2.2,表2.3
| chapter2.sce |
format('v',15)
[res] = NI_order(0,2,func1,c_mid,Q1ex,10) |
|
| 表2.4
| chapter2.sce |
format('v',15)
[res] = NI_order(0,2,func1,c_trape,Q1ex,10) |
|
| 表2.5
| chapter2.sce |
format('v',15)
[res] = NI_order(0,2,func1,c_simps,Q1ex,10) |
|
| 例2.9,表2.9(A)
| chapter2.sce |
order_plot1(0,1,func3,c_simps,Qex2) |
nc1.pdf |
| 例2.9,表2.9(B)
| chapter2.sce |
order_plot2(0,1,func3,c_simps,Qex2) |
nc2.pdf |
| 例2.9,表2.10
| chapter2.sce |
order_plot3(0,1,func3,c_simps,Qex2) |
nc3.pdf |
| 例2.14,図2.11
| chapter2.sce |
result = output_lag2(0,4,4,func4,200)
result = output_lag2(0,4,7,func4,200) |
lag2.pdf |
| 例2.16,表2.7
| chapter2.sce |
[value, err]=nc1(-5,5,func5,4,Qex5)
[value, err]=nc1(-5,5,func5,5,Qex5)
[value, err]=nc1(-5,5,func5,6,Qex5)
[value, err]=nc1(-5,5,func5,7,Qex5)
[value, err]=nc1(-5,5,func5,8,Qex5) |
|
| 例2.16,図2.12
| chapter2.sce |
result = output_lag2(-5,5,4,func5,200)
result = output_lag2(-5,5,12,func5,200) |
lag2.pdf |
| 表2.8
| chapter2.sce |
[x,w] = gaulege(4)
[x,w] = gaulege(5)
[x,w] = gaulege(6)
[x,w] = gaulege(7) [注2と注3を参照]
|
|
| 問題2.2
| chapter2.sce |
integ = c_simps1(0,%pi/2,200,func7,%pi/6)
integ = c_simps1(0,%pi/2,100,func7,%pi/6)
integ = c_simps1(0,%pi/2,200,func7,%pi/4)
integ = c_simps1(0,%pi/2,100,func7,%pi/4)
integ = c_simps1(0,%pi/2,200,func7,%pi/(12))
integ = c_simps1(0,%pi/2,100,func7,%pi/(12)) |
|
| 問題2.3,図A.3
| chapter2.sce |
order_plot3(0,1,func3,c_mid,Qex2) |
nc3.pdf |
| 問題2.5,表A.1
| chapter2.sce |
[res] = error_GC1(func51,-5,5,func5,Qex5) |
|
| 例3.21
| chapter3.sce |
A=[3,-1,2;-1,4,1;2,1,3];
[x,kit,vres,vp,vr,al,be] = cg(A,[4,4,6]',1d-8) |
|
| 問題3.3
| chapter3.sce |
A=[4,3,0;3,4,-1;0,-1,4];
b=[10,8,10]';
[vx,it,vp,vr,vres,al,be] = cg(A,b,1d-12) |
|
| 例4.8,表4.1
| chapter4.sce |
[res]=Euler2(6) |
|
| 例4.12,図4.1
| chapter4.sce |
[res] = OrderPlot2(func1, func1sol, 0, 1, 0) |
ode_plot2.pdf |
| 例4.18,図4.2左
| chapter4.sce |
OdePlot3(RK, LotVol, 0, 4, [0.5,0.8], 200) |
ode_plot3.pdf |
| 例4.18,図4.2右
| chapter4.sce |
OdePlot2(RK, LotVol, 0, 8, [0.5,0.8], 200) |
phase0.pdf |
| 例4.19,図4.3
| chapter4.sce |
PlotvdPol(RK, 15) |
vdPol0.pdf |
| 例4.20,図4.4
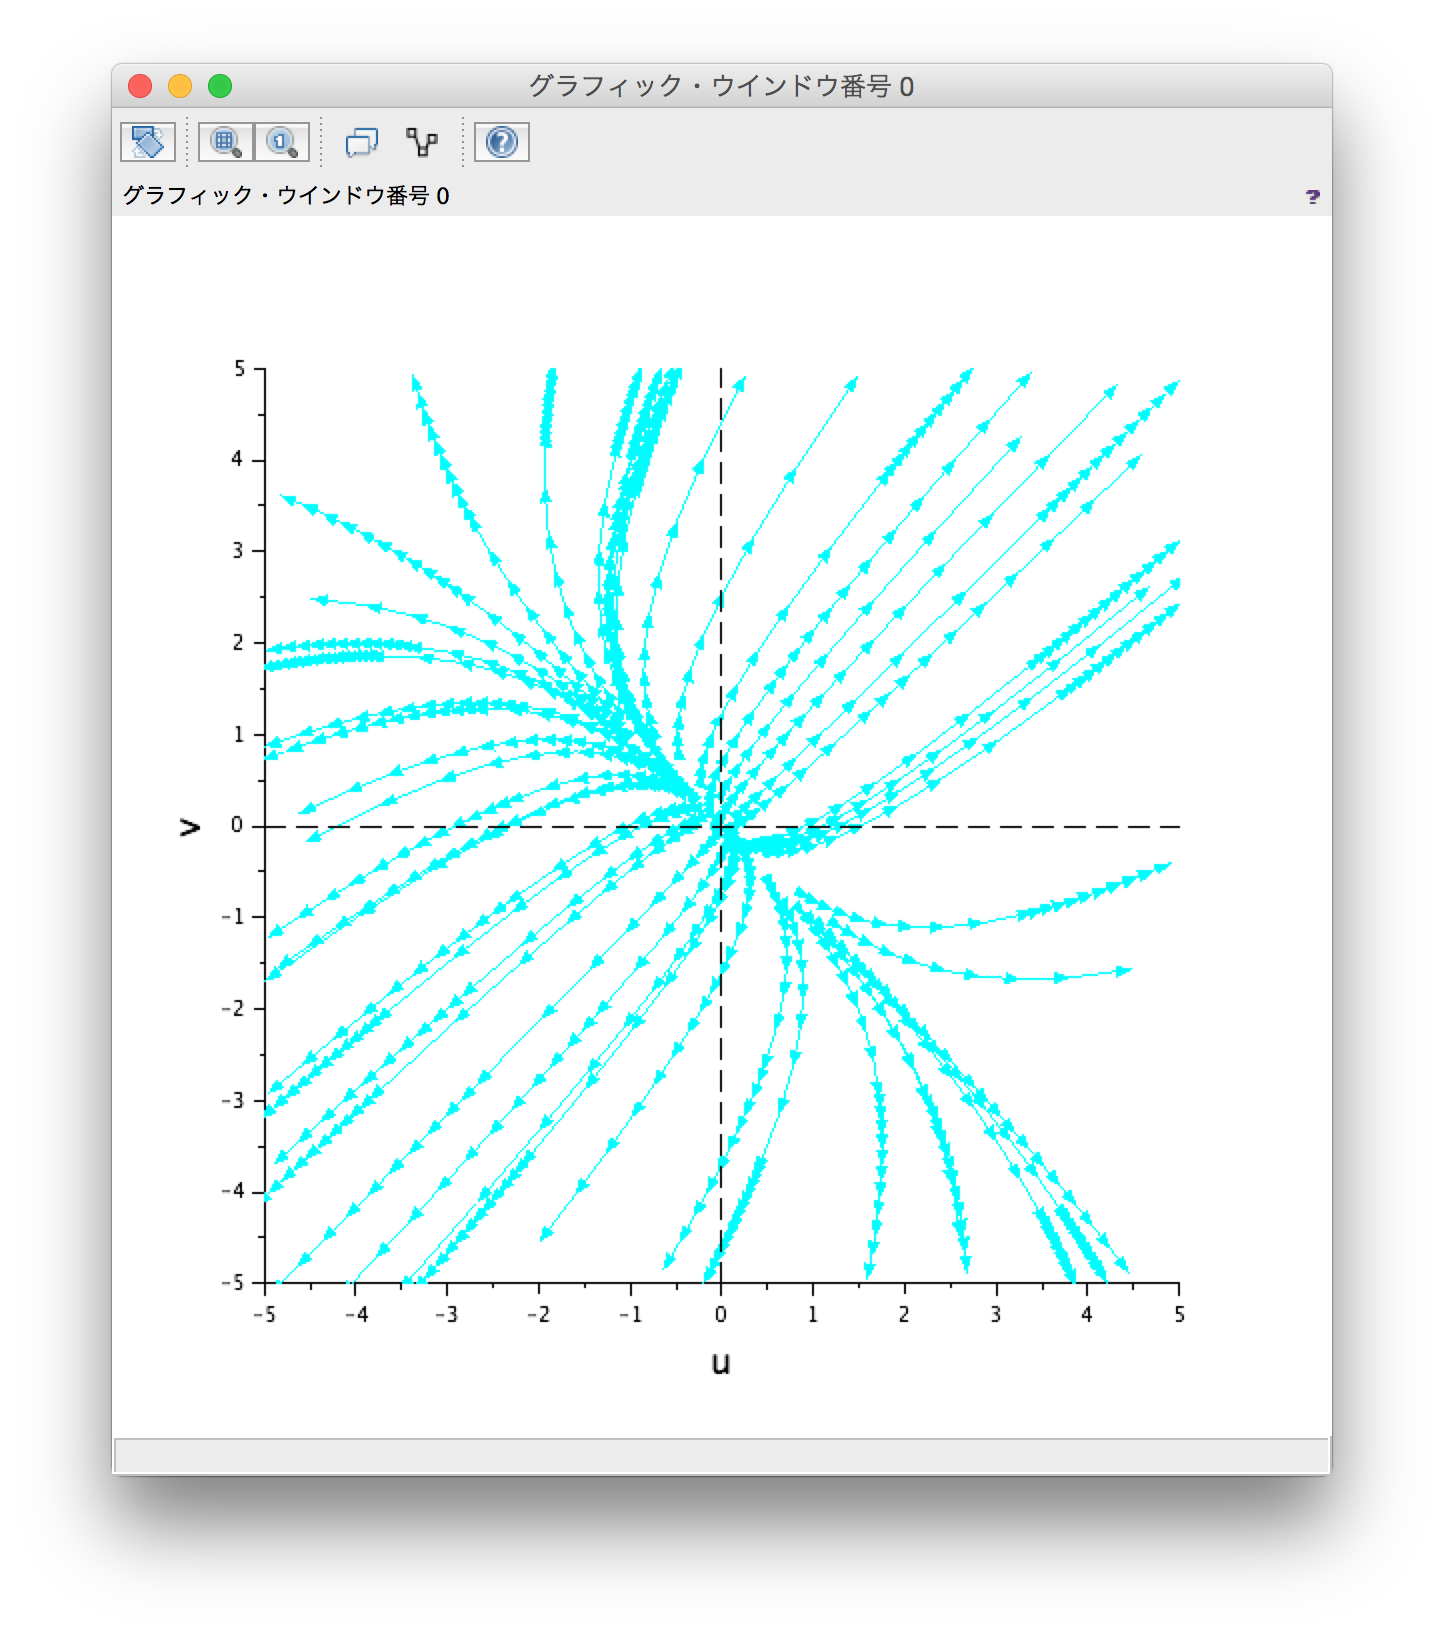
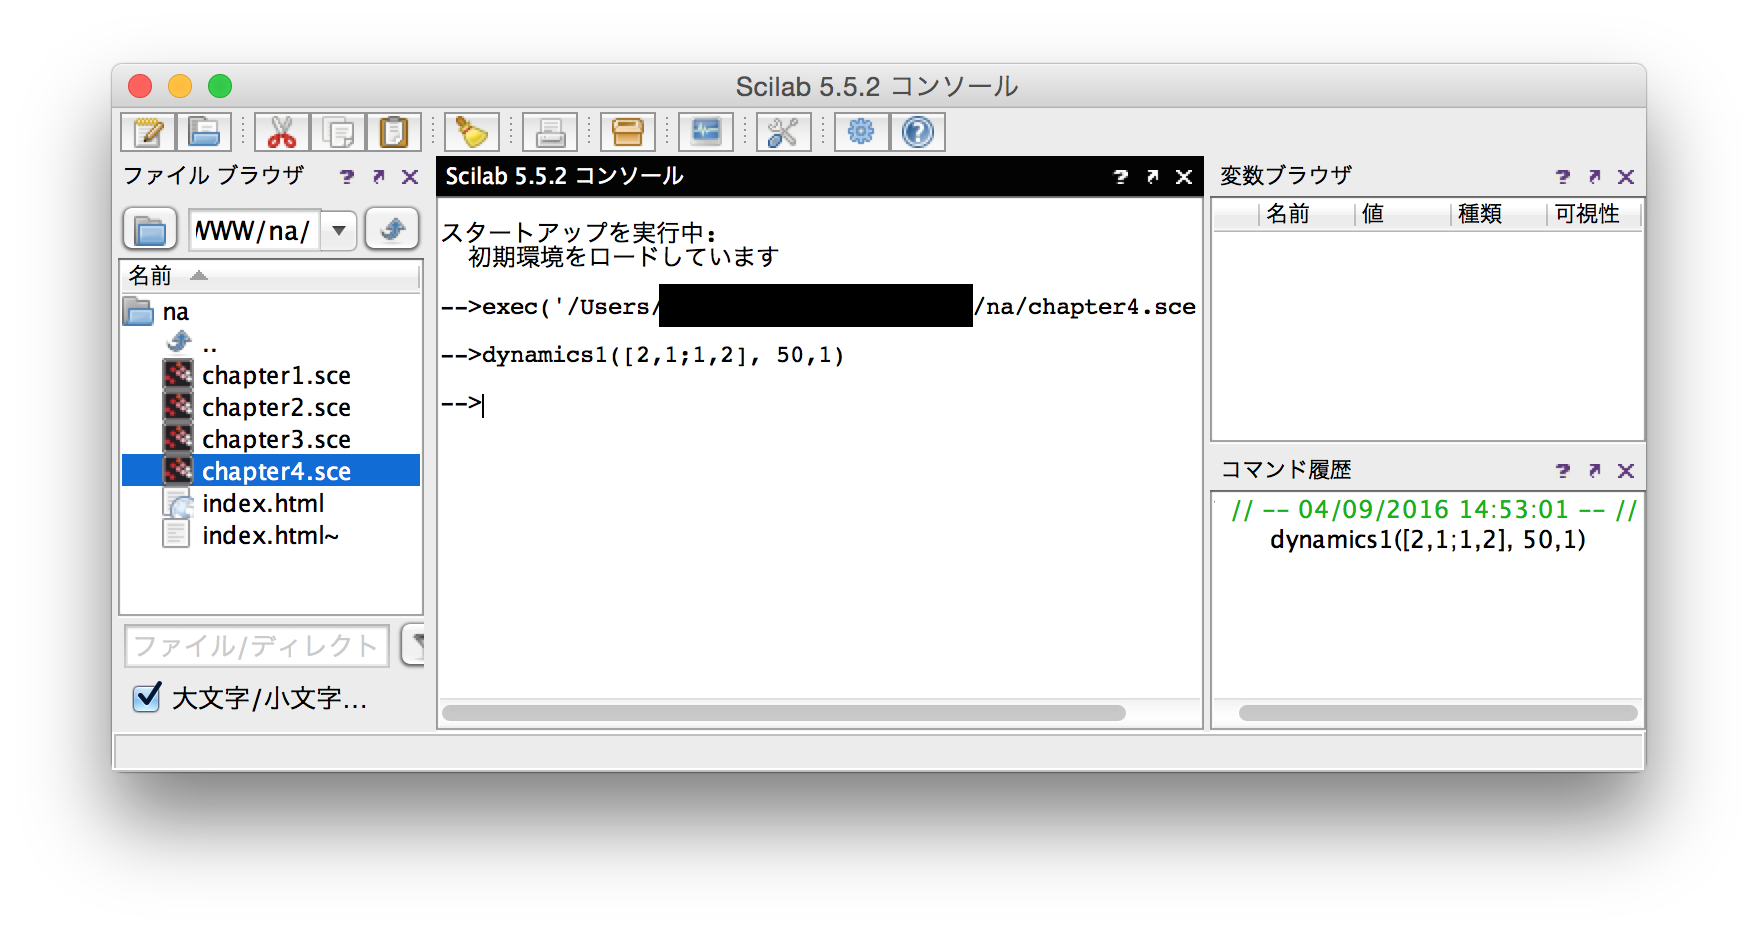
| chapter4.sce |
dynamics1([2,1;1,2], 50,1)
dynamics1([1,2;2,1], 50,1.5) |
dynamic1.pdf |
| 例4.21,図4.5
| chapter4.sce |
PlotPlanet(RK, 15, 0.5)
PlotPlanet(RK, 15, 0.8)
|
Planet0.pdf |
| 図4.6
| chapter4.sce |
OdePlot4(2*%pi*2, 0.1)
OdePlot4(2*%pi*100, 0.1)
|
heun1.pdf |
| 図4.7
| chapter4.sce |
CN1(2*%pi*100,0.1)
CN1(2*%pi*200,0.1)
|
cn1.pdf |
| 図4.8
| chapter4.sce |
CN1(2*%pi*100,0.1)
CN1(2*%pi*200,0.1)
|
cn1.pdf |
| 図4.8
| chapter4.sce |
[res] = OrderPlot5(1)
|
heun_cn1.pdf |
| 図4.9
| chapter4.sce |
OdePlot8(1) |
logistic0.pdf |
| 図4.10左
| chapter4.sce |
bvpPlot1(50, 1, func10) |
bvp1.pdf |
| 図4.10右
| chapter4.sce |
[res]=bvpOrder1(8) |
bvporder1.pdf |
| 図4.11
| chapter4.sce |
bvp5(100, 0.3)
bvp5(100, 0.1)
bvp5(100, 0.05)
bvp5(100, 0.01) |
bvp5.pdf |
| 図4.10右
| chapter4.sce |
[res]=bvpOrder1(8) |
bvporder1.pdf |
| 問題4.2,表A.2/A.3
| chapter4.sce |
[res]=rate(func5,func5sol,Euler,0,0.99,1,4)
[res]=rate(func5,func5sol,RK,0,0.99,1,4)
[res]=rate(func5,func5sol,Euler,0,0.99,1,8)
[res]=rate(func5,func5sol,RK,0,0.99,1,8) |
|
| 問題4.3,図A.4
| chapter4.sce |
OdePlot1(RK,func6, 0, 10, 10, 40)
OdePlot1(RK,func6, 0, 10, 10, 200) |
ode_plot0.pdf |
| 問題4.4,図A.5
| chapter4.sce |
[res] = OrderPlot7(func1, func1sol, 0, 1, 0)
|
ode_plot7.pdf |
| プログラム5.1
| chapter5.sce |
mepsilon(1) |
|
| 例5.7,図5.4
| chapter5.sce |
plot_func(1-10^(-1),1+10^(-1),func3,500)
plot_func(1-10^(-2),1+10^(-2),func3,500)
|
p1.pdf |
| 例5.7,図5.5
| chapter5.sce |
plot_func(1-10^(-1),1+10^(-1),func1,500)
plot_func(1-10^(-2),1+10^(-2),func1,500)
|
p1.pdf |
| 例5.7,図5.6
| chapter5.sce |
plot_func(1-10^(-1),1+10^(-1),func2,500)
plot_func(1-10^(-2),1+10^(-2),func2,500)
|
p1.pdf |
| 問題5.4
| chapter5.sce |
[res]=dcos(60)
[res]=dcos2(60) |
|
| 例6.3,図6.1
| chapter6.sce |
lutime(1200) [注4を参照] |
lutime.pdf |
| 例6.20,図6.2
| chapter6.sce |
result = output_lag6(0,%pi,10,func4,200)
result = output_lag6(0,%pi,30,func4,200) |
lag6.pdf |
| 例6.20,図6.3
| chapter6.sce |
result = output_lag2(0,%pi,10,func4,200)
result = output_lag2(0,%pi,30,func4,200) |
lag2.pdf |
| 例6.25,表6.3
| chapter6.sce |
A=hil_mat(30);
[natori(A),cond(A,1)] |
|
| 例6.26,表6.4
| chapter6.sce |
result = output_lag6(0,%pi,5,func4,200)
result = output_lag6(0,%pi,10,func4,200)
result = output_lag6(0,%pi,30,func4,200)
|
|
| 例6.28,図6.4
| chapter6.sce |
rec1(50, 2, 2/3) |
rec1.pdf |
|
 )までお問い合わせください.
 )までお問い合わせください.